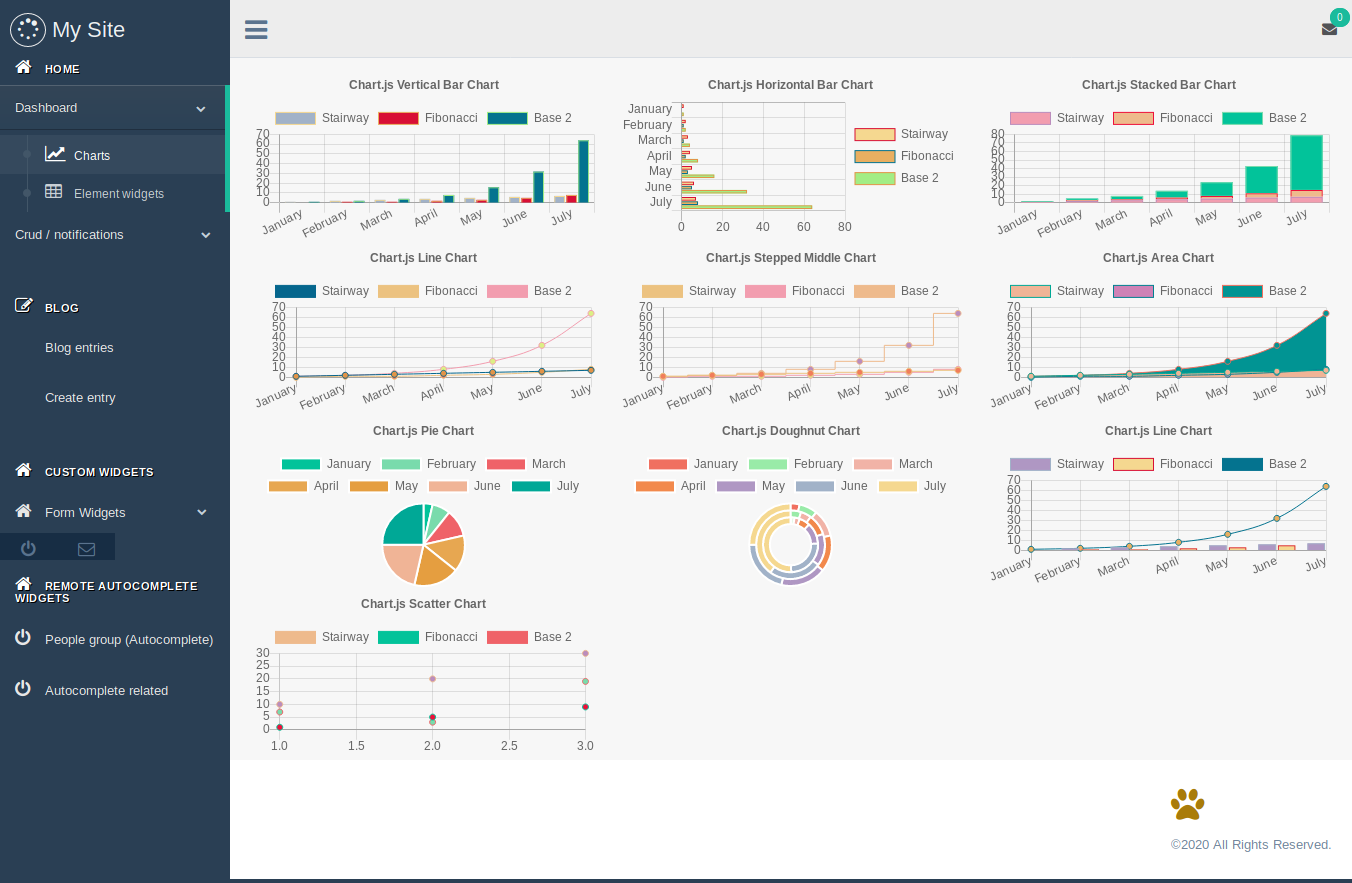
Chart Widget
You can register automatically chart widgets api creating a gtcharts.py in your app, djgentelella look for charts view for all apps in INSTALLED_APP.
This app use Chartjs for build chart, you need to provide the right structure in the dataset, for examples see here
from djgentelella.groute import register_lookups

@register_lookups(prefix="verticalbar", basename="verticalbar")
class VerticalBarChartExample(BaseChart, VerticalBarChart):

       def get_labels(self):
            return [...]
       def get_def get_datasets(self):
            return ...
       def get_title(self):
            return {'display': True,
                    'text': 'Chart.js Example'
                    }
You can use @register_lookups in any part of your code, but remember to import it on url.py, and set your app before ‘djgentelella’. Also prefix and basename needs to be unique.
To show in templates you can use this snippet:
<div class="row">
    <div class="col-md-4">
    {% include 'gentelella/widgets/chartjs.html' with graph_url=context_url_variable %}
    </div>
</div>
To build url you can use
from django.urls import reverse
context_url_variable = reverse(verticalbar-list)
Note
To build the url you need to append list to basename like <basename>-list
Available Charts
VerticalBarChart
HorizontalBarChart
StackedBarChart
LineChart
PieChart
DoughnutChart
ScatterChart
Note
Pie and Doughnut have different way to build datasets, see chartjs documentation for more.
Chart Options
You can build your own options overwritting this methods.
get_responsive
get_maintainAspectRatio
get_indexAxis
get_legend
get_title
get_tooltips
get_hover
get_scales
get_elements
get_animation
get_plugins
Each one returns the value of the option it names, and get_options puts it
where Chart.js expects it. get_title, get_legend and get_tooltips
end up under options.plugins (as title, legend and tooltip),
which is where Chart.js 3 moved them; get_plugins is for any other plugin,
including third party ones, and is merged with the three above.
Scales are a dict keyed by axis name, not the two lists of Chart.js 2:
def get_scales(self):
    return {'x': {'stacked': True},
            'y': {'stacked': True,
                  'title': {'display': True, 'text': 'units'}}}
Chart.js 4 vocabulary
This library moved from Chart.js 2 to Chart.js 4, which renamed a good part of the configuration. If you are porting charts written for the old release:
The getter names did not change, and the last five rows are translated for you:
a get_scales still returning xAxes/yAxes, an elements.rectangle
block, a steppedLine dataset key and a get_type returning
horizontalBar all keep working. Treat that as a grace period, not as the
supported vocabulary.
Tooltip callbacks
A callback cannot travel as JSON, so the server sends its name and the browser
looks it up in document.chartcallbacks:
document.chartcallbacks.mylabel = function (context) {
    return context.dataset.label + ': ' + context.parsed;
}
def get_tooltips(self):
    return {'callbacks': {'label': 'mylabel'}}
label, beforeLabel, afterLabel, title and footer are looked
up this way. Chart.js 3 replaced the old (item, data) arguments with a
single tooltip context object, so a callback written for Chart.js 2 has to be
updated.